The trend line, generated from the daily weight readings by an exponentially smoothed moving average, is so smooth and regular it can be used to calculate average weight gain or loss and, from that, the daily excess or shortfall of calories that caused the observed change in weight.
For longer term changes, simply subtracting the trend reading at the end of the month from the trend at the beginning and dividing by four gives a reasonable approximation of the rate of weight gain or loss per week during that month. Clearly, this number should be interpreted in conjunction with the chart. If the calculation indicates no weekly gain but the chart shows a steep uptrend for the first two weeks and a compensating decline in the latter two, the situation is not one of stability but oscillation, to be damped if possible.
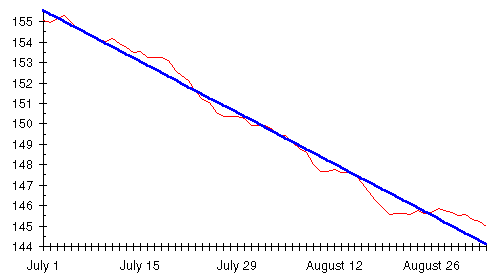
Consider my chart for August of 1988 on page
![]() . My weight, measured by the trend line,
began the month at 159.74 and ended the month at 152.223 pounds. This
represents a weight loss of:
. My weight, measured by the trend line,
began the month at 159.74 and ended the month at 152.223 pounds. This
represents a weight loss of:
Since each pound gained or lost is equivalent to 3500 calories excess, stored as fat, or deficit, burned from fat by the rubber bag, this can be expressed as a daily calorie excess or shortfall by multiplying by calories per pound.
The Excel weight management worksheets actually use a more
sophisticated and accurate technique to estimate the rate of weight
loss or gain and the corresponding calorie shortfall or excess.
Instead of just using the trend at the start and end of the month,
they find a straight line that best approximates the overall
trend and then use the slope of that line as the rate of change
in weight. The mathematical details of this are given on
page ![]() . If you're calculating by hand,
it isn't worth the extra work to get the slightly more accurate values
this technique provides; just use the first and last trend values as
described above.
. If you're calculating by hand,
it isn't worth the extra work to get the slightly more accurate values
this technique provides; just use the first and last trend values as
described above.
Here is the straight line trend determined by this procedure superimposed on Dexter's moving average, from which it was calculated.
As you can see, the computed straight line trend accurately reflects the rate of change in the moving average. Fitting a straight line to the trend doesn't eliminate the need to interpret the weight loss or gain and calorie excess or deficit in conjunction with the chart, taking into account the shape of the trend line. Consider this chart of Marvin's diet, showing the moving average and two very different straight line trends that can be calculated from it.
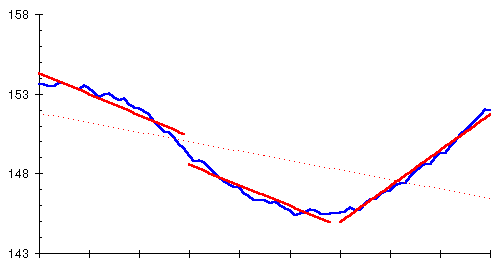
The familiar moving average trend line is drawn as before. The dashed line is the best fit to all 90 days of Marvin's diet. It's accurate, after a fashion, since Marvin ended the diet below the weight where he started, and he lost weight for 50 days but gained only in the last 40. But, obviously, it misses the point. What really happened was a sequence of successful weight loss, stability for a brief period, then rapid weight gain. Short term straight line trends, in this case month by month, identify the turnaround and provide accurate estimates of weight change and calories for each month.
As long as the moving average is roughly straight, the weekly weight and daily calorie figures can be relied upon. If there's a major change in trend during the month, you're better off basing your actions on the most recent direction of the trend rather than longer term values that don't account for a kink in the curve.
By John Walker