Next Up Previous Contents Index
Next: Units and Conversion Up: Calculating moving averages Previous: Exponentially smoothed moving

Calculating best fit trends

            To calculate the rate of weight loss or gain and the calorie shortfall or excess responsible for it from the moving average trend line, the Excel spreadsheet finds the straight line trend that best fits the curve traced out by the moving average by the method of least squares. The process of finding a line that accurately represents the trend of a collection of data points is called linear regression, and the least squares method is the most frequently used approach to the problem.

Any non-vertical straight line (you'd be in a fine pickle if your weight trend line were vertical, wouldn't you?) can be expressed in the form:

Y = mX + b

where m is the slope, giving the change in the Y axis value for each unit change along the X axis, and b is the intercept, the point at which the line crosses the Y axis when X is zero.

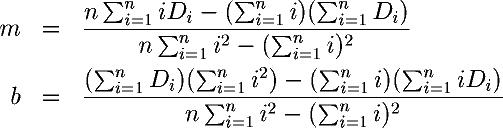
To find m and b for the line that best fits a collection of data points D1, D2, ... Dn we calculate:

m = \frac{n\sum_{i=1}^{n} i D_i-(\sum_{i=1}^{n} i)(\sum_{i=1}^{n} D_i)}{n\sum_{i=1}^{n} i^2-(\sum_{i=1}^{n} i)^2}, b = \frac{(\sum_{i=1}^{n} D_i)(\sum_{i=1}^{n} i^2)-(\sum_{i=1}^{n} i)(\sum_{i=1}^{n} i D_i)}{n\sum_{i=1}^{n} i^2-(\sum_{i=1}^{n} i)^2}

Since we're only interested in the rate of change, we only need the slope, m, which gives the daily rate of change in the line that best fits the moving average trend curve. From the slope, the average weight change per week is just seven times the daily change,

7m

and the average daily calorie deficit (if negative) or excess (if positive) is:

3500m


By John Walker