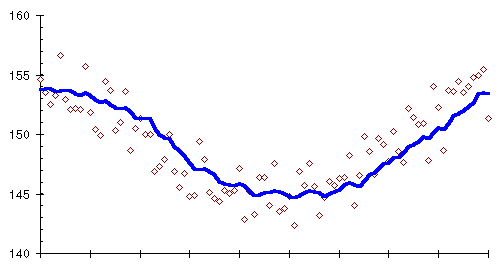
The uncanny way a moving average ferrets the trend from a mass of confusing measurements can be seen by plotting the 10 day moving average along with the original daily weights, shown as small diamonds.

The moving averages we've used so far give equal significance to all the days in the average. This needn't be so. If you think about it, it doesn't make much sense, especially if you're interested in using a longer-term moving average to smooth out random bumps in the trend. Assume you're using a 20 day moving average. Why should your weight almost three weeks ago be considered equally relevant to the current trend as your weight this morning?
Various forms of weighted moving averages have been developed to address this objection. Instead of just adding up the measurements for a sequence of days and dividing by the number of days, in a weighted moving average each measurement is first multiplied by a weight factor which differs from day to day. The final sum is divided, not by the number of days, but by the sum of all the weight factors. If larger weight factors are used for more recent days and smaller factors for measurements further back in time, the trend will be more responsive to recent changes without sacrificing the smoothing a moving average provides.
An unweighted moving average is simply a weighted moving average with all the weight factors equal to 1. You can use any weight factors you like, but a particular set with the jawbreaking monicker ``Exponentially Smoothed Moving Average'' has proven useful in applications ranging from air defence radar to trading the Chicago pork belly market. Let's put it to work on our bellies as well.
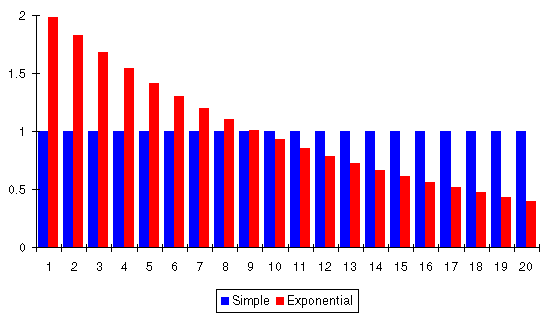
This graph compares the weight factors for an exponentially smoothed 20 day moving average with a simple moving average that weights every day equally.

Exponential smoothing gives today's measurement twice the significance the simple average would assign it, yesterday's measurement a little less than that, and each successive day less than its predecessor with day 20 contributing only 20% as much to the result as with a simple moving average.
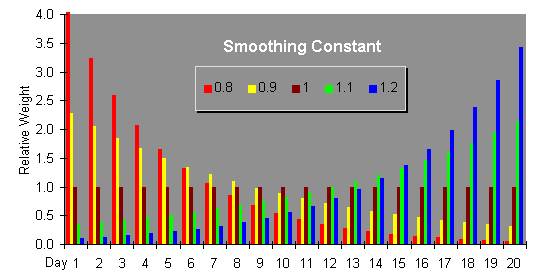
The weight factors in an exponentially smoothed moving average are successive powers of a number called the smoothing constant. An exponentially smoothed moving average with a smoothing constant of 1 is identical to a simple moving average, since 1 to any power is 1. Smoothing constants less than 1 weigh recent data more heavily, with the bias toward the most recent measurements increasing as the smoothing constant decreases toward zero. If the smoothing constant exceeds 1, older data are weighted more heavily than recent measurements.
This plot shows the weight factors resulting from different values of the smoothing constant. Note how the weight factors are all 1 when the smoothing constant is 1.

When the smoothing constant is between 0.5 and 0.9, the weight given to old data drops off so rapidly compared to more recent measurements that there's no need to restrict the moving average to a specific number of days; we can average all the data we have, right back to the very start, and let the weight factors computed from the smoothing constant automatically discard the old data as it becomes irrelevant to the current trend.
By John Walker