When faced with apparently random variation in a collection of things, the first thing a statistician does is compute an average or, more precisely, the arithmetic mean. What's the average height of 30 year old men? Measure a whole bunch of them, add up their heights, and divide by the number you measured. Whether the number you get is useful for anything is another matter, but at least you can always easily calculate an average.
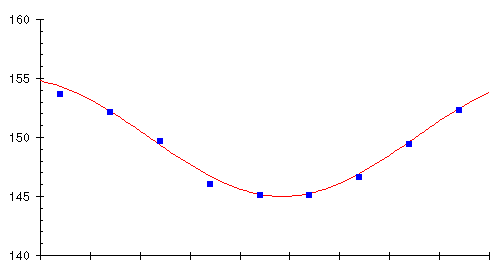
Since the weight trend is being obscured by an apparently random day to day variation caused mostly by the instantaneous water content of the rubber bag, what about averaging several day's weights and plotting the averages instead? Let's try it; take the weights for each 10 day period on the graph, calculate the average, and plot it as a little square in the middle of the 10 day interval. Here's the result, overlaid on the original chart showing the true weight trend.

It looks like we're on to something here! The averages track the trend very closely indeed. Averaging has filtered out the influence of the daily variations, leaving only the longer term trend. But we can do even better. Rather than waiting for ten days to elapse before computing the average, why not each day calculate the average of the last ten days? This will give us a continuous graph rather than just one box every ten days, and we don't have to wait 10 days for the next average. Here's what happens when we try this scheme.

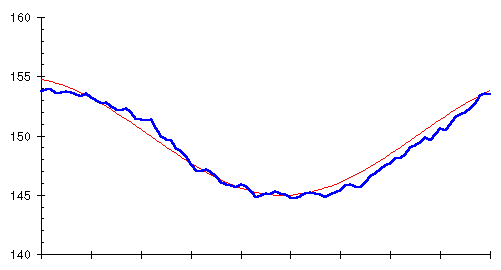
Bingo! Averaging the last ten days and plotting the average every day (the heavy blue line) closely follows the trend of actual weight (the thin red line). What we've just computed is called a 10 day moving average, ``moving'' because the average can be thought of as sliding along the curve of raw weight measurements, averaging the last 10 every day.
You'll notice, if you look closely at the two curves, that the moving average, although the same shape, lags slightly behind the actual trend. This occurs because the moving average for each day looks backward at the last 10 days' data, so it's influenced by prior measurements as well as the present. The lag might seem to be a problem at first glance, but it will actually turn out to be advantageous when we get around to using a moving average for weight control.
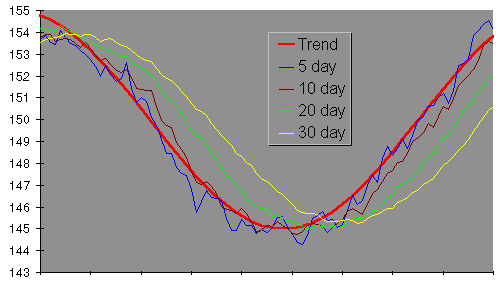
We can base a moving average on any number of days, not just 10. Here are 5, 10, 20, and 30 day moving averages of Marvin's daily weight.

As the number of days in the moving average increases, the curve becomes smoother (since day to day fluctuations are increasingly averaged out), but the moving average lags further behind the actual trend since the average includes readings more distant in the past.
By John Walker