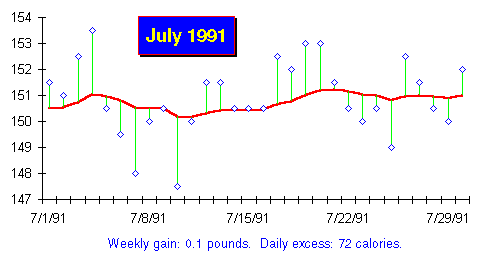
Continue logging weight daily and producing trend charts at the end of the month. As long as the trend remains within the five pound band around your goal, month-end chart analysis focuses on the slope of the trend line and the calorie excess or deficit it indicates. Consider the following trend chart.

The goal is 150 and the trend is allowed to vary freely in the 147.5 to 152.5 band. Since the trend never touched either limit this chart represents success in keeping the trend close to the goal. However, there's a slight upslope, equivalent to 72 extra calories a day. In addition the trend varied between 150 and 151, not back and forth around 150. This suggests you should cut back slightly on calories the next month. Since 72 calories a day is less than one tablespoon of salad dressing or about half an ounce of cheese, you could make the adjustment by lightening up slightly on salad at dinner or by ordering your lunchtime burger without cheese. Had the trend line remained below 150 all month and shown a slow downslope, you'd add comparable foods in the next month to move up to 150.
Adjusting your food consumption based on the trend forms an exquisitely sensitive negative feedback system. The slope of the trend reacts to even the slightest changes in calorie balance and allows you to make adjustments, up or down, so slight they are scarcely perceptible. By insuring you get just the calories you need, you're guaranteed to never be hungry as long as you adjust the size of your meals and their schedule based on your need for calories throughout the day. As you gain experience balancing the trend line it will become second nature, and you'll probably find the fluctuations decrease even more.
By John Walker