To extract the small change in body fat from the much larger day to day variation in weight that's largely a consequence of water flowing in and out of the rubber bag, we need to find the trend beneath all the daily variations: the long term direction of weight. But this is hardly a new problem; stock and commodity speculators have been doing this for over a century.
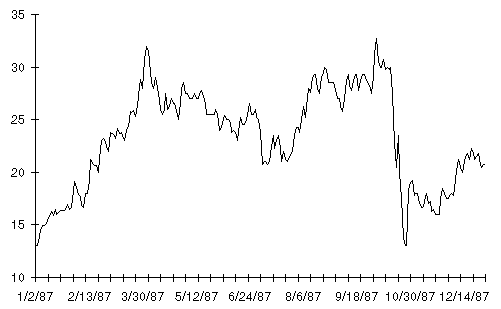
Here's the kind of raw data a stock trader looks at. This is a chart of the daily closing price of the stock of Autodesk, Inc., the company I founded, in the eventful year of 1987. That year saw Autodesk hit all-time highs, get clobbered by the Crash of '87, then begin a slow recovery as the year ended (which eventually carried it to a high of $60/share in 1990).

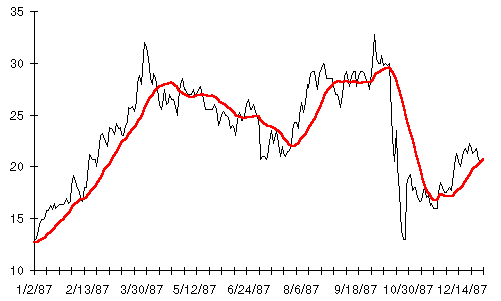
The price action of Autodesk in 1987 was more clearcut than in most years, yet an investor who looked at each day's price as it was quoted in the paper would suffer the same kind of ups and downs as Dexter endured throughout his diet. The most common technique for extracting an underlying trend from daily price data is a moving average. Here's a moving average view of Autodesk stock in 1987. The moving average is the red line; the daily stock price is shown in black.

The moving average has distilled the trend from the daily price fluctuations. The six major up and down trends of the year are now readily apparent. If you'd owned the stock only while the moving average was rising you'd have ended the year with a tidy profit, notwithstanding having your gains from August through October wiped out in a single day by the Crash. (Whether price charts and moving averages can predict the future price of a stock or commodity is controversial; many speculators swear by them and have profits to show for it while the majority of economists believe it's all nonsense. Here we aren't trying to predict anything; we're using a moving average solely to clear away the day to day clutter in order to see larger, long term changes. Nobody disputes the validity of moving averages for this; they are so used in many areas, for example, plotting an airplane's course from a series of radar returns.)
By John Walker